


Standard deviation tells you how spread out a set of numbers is. Two classes can both average 75 on a test, but if one class has scores between 70 and 80 and the other has scores between 40 and 100, they are very different groups. Standard deviation puts a number on that difference. It is used in science, finance, quality control and everyday data analysis, and the calculation is just five steps once you know which version of the formula to use. This guide explains the sample and population formulas, walks through a full example by hand, shows the Excel functions and explains how to read your result.
Updated November 2026
In this guide
- What standard deviation measures
- Sample vs population: which formula to use
- The formulas
- Worked example by hand
- Standard deviation in Excel and Google Sheets
- How to interpret the result
- Comparing spread across data sets
- A second worked example with real-world data
- Step-by-step Excel workflow
- Common mistakes
What standard deviation measures
The standard deviation is the typical distance of a value from the mean. A small standard deviation means the numbers cluster close to the average, and a large one means they are widely scattered. It is expressed in the same units as the data, so if you measure heights in centimeters the standard deviation is also in centimeters. That makes it easier to interpret than variance, which is in squared units.
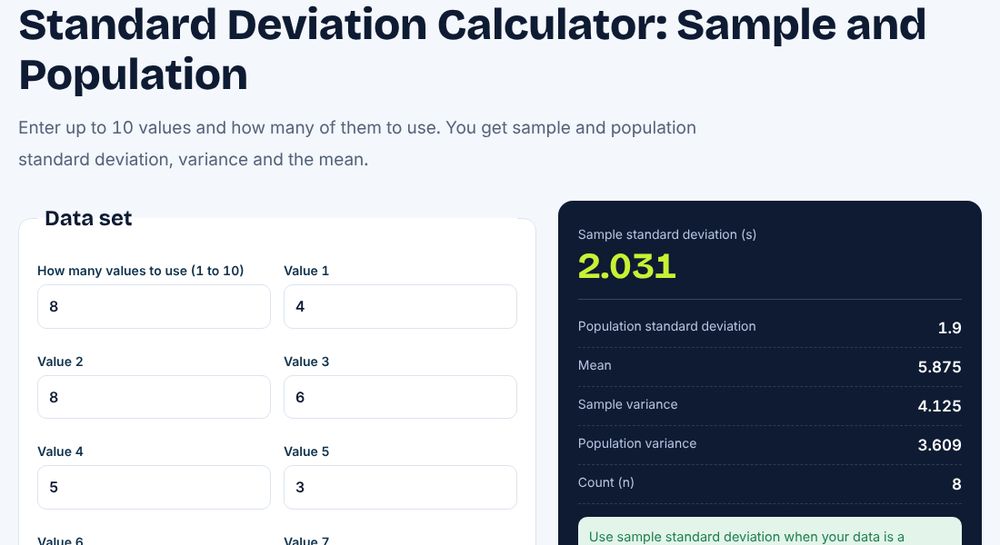
You can check any result with our standard deviation calculator, which gives both the sample and the population value for up to ten numbers.
Sample vs population: which formula to use
Use the population formula when your data includes every member of the group you care about, such as the test scores of all 30 students in one class. Use the sample formula when your data is only a subset of a larger group, such as 30 customers surveyed out of 10,000. The difference is the divisor: population divides by n, sample divides by n minus 1.
Dividing by n minus 1 is called Bessel’s correction. A sample tends to underestimate the spread of the whole group, because its own mean sits closer to its own values than the true mean does. Using n minus 1 corrects that bias. In practice, if you are unsure, the sample version is the safer default because real data is almost always a sample.
The formulas
Population standard deviation: the square root of (the sum of each value minus the mean, squared, divided by n).
Sample standard deviation: the square root of (the sum of each value minus the mean, squared, divided by n minus 1).
Variance is the same expression before the square root. So standard deviation is simply the square root of variance.
Worked example by hand
Take the data set 4, 8, 6, 5, 3, 7, 9, 5. It has n equal to 8 values.
- Find the mean. The sum is 4 + 8 + 6 + 5 + 3 + 7 + 9 + 5 = 47. The mean is 47 divided by 8, which is 5.875.
- Subtract the mean from each value and square the result. See the table below.
- Add the squared deviations. The total is 28.875.
- Divide. For the sample, divide by n minus 1, which is 7, giving a variance of 4.125. For the population, divide by 8, giving a variance of 3.609.
- Take the square root. Sample standard deviation is the square root of 4.125, which is 2.031. Population standard deviation is the square root of 3.609, which is 1.900.
| Value | Value minus mean | Squared |
|---|---|---|
| 4 | -1.875 | 3.516 |
| 8 | 2.125 | 4.516 |
| 6 | 0.125 | 0.016 |
| 5 | -0.875 | 0.766 |
| 3 | -2.875 | 8.266 |
| 7 | 1.125 | 1.266 |
| 9 | 3.125 | 9.766 |
| 5 | -0.875 | 0.766 |
| Total | 0 | 28.875 |
The squared column is rounded to three decimals, so adding the rounded numbers gives 28.876 while the exact total is 28.875. The deviations in the middle column always add up to zero, which is a handy check on your arithmetic.
Standard deviation in Excel and Google Sheets
Excel has separate functions for the two versions. With your numbers in A2:A9, use =STDEV.S(A2:A9) for the sample standard deviation and =STDEV.P(A2:A9) for the population standard deviation. Variance uses =VAR.S(A2:A9) and =VAR.P(A2:A9), and the mean is =AVERAGE(A2:A9). For the example above Excel returns 2.031 and 1.900. The older function names STDEV and STDEVP still work for compatibility but the newer ones are clearer. Google Sheets uses the same names. See Microsoft’s documentation of the STDEV.S function in the sources below.
How to interpret the result
For data that is roughly bell-shaped, about 68 percent of values fall within one standard deviation of the mean, about 95 percent within two and about 99.7 percent within three. This is called the empirical rule. With a mean of 5.875 and a sample standard deviation of 2.031, you would expect most values between about 3.8 and 7.9, and nearly all between 1.8 and 9.9. In our example, all eight values are between 3 and 9, which fits.
A value more than two or three standard deviations from the mean is unusual and is often worth checking for errors. Standard deviation is also affected by outliers, because squaring gives large deviations extra weight. If one entry is mistyped, the standard deviation can jump noticeably.
Comparing spread across data sets
Standard deviation alone does not tell you whether the spread is large or small relative to the average. A standard deviation of 5 is huge for a mean of 10 but tiny for a mean of 10,000. To compare, divide the standard deviation by the mean to get the coefficient of variation. For the example, 2.031 divided by 5.875 is 0.346, or 34.6 percent. Use this when you compare data sets measured on different scales, such as the price volatility of two products.
A second worked example with real-world data
A cafe records the number of customers per hour over seven hours: 12, 15, 11, 18, 14, 16, 13. The sum is 99, so the mean is 14.143. Deviations are -2.143, 0.857, -3.143, 3.857, -0.143, 1.857 and -1.143. Squared they are 4.592, 0.735, 9.878, 14.878, 0.020, 3.449 and 1.306, totaling 34.857. Because this is a sample of the cafe’s many possible hours, divide by 6 to get a variance of 5.810, and take the square root for a standard deviation of 2.41 customers. The owner can read this as: most hours bring between about 12 and 17 customers, and an hour with 25 would be unusual. This simple summary helps with staffing decisions, and you can reproduce it with =STDEV.S(B2:B8).
Step-by-step Excel workflow
Enter your data in one column with a header. In an empty cell type =AVERAGE(A2:A9) for the mean. In the next cell type =STDEV.S(A2:A9). To see how many values are within one standard deviation, use =COUNTIFS(A2:A9,">="&D1-D2,A2:A9,"<="&D1+D2), where D1 holds the mean and D2 the standard deviation. That uses the COUNTIFS function, and you can learn more in our COUNTIFS guide. For a quick chart, insert a column chart of your values and add a horizontal line at the mean so you can see the spread visually. If your data lives in a table, structured references such as =STDEV.S(Table1[Sales]) update automatically when you add rows.
Remember to document whether you used the sample or population version in a note next to the result so that anyone reviewing the sheet understands the choice.
Common mistakes
People often use the population formula on sample data, which makes the result too small. Others forget to take the square root at the end and report the variance instead. A third mistake is calculating deviations from the wrong mean, for example the mean of a different column. If you work by hand, check that the deviations add up to zero before you square them. When you use a spreadsheet, check that the range includes only the numbers, because text and blank cells are ignored by STDEV functions while zeros are counted. Related guides include COUNTIFS in Excel for counting values in ranges and the average calculator.
As a final habit, always report the sample size along with the standard deviation, for example “mean 14.1, standard deviation 2.4, n equal to 7”, so readers can judge how much to trust the figure.
Frequently asked questions
What is the difference between sample and population standard deviation?
Population divides by n and applies when you have every value. Sample divides by n minus 1 and applies when your data is a subset of a larger group.
Is standard deviation the same as variance?
No. Variance is the average squared deviation. Standard deviation is its square root, so it uses the same units as your data.
Can standard deviation be negative?
No. It is a square root of a sum of squares, so it is zero or positive.
What does a standard deviation of zero mean?
Every value in the data set is the same.
Which Excel function should I use?
Use STDEV.S for samples and STDEV.P for a full population.
Related guides and free tools
- Standard deviation calculator
- Average calculator
- Percent error calculator
- How to calculate GPA
- All free calculators and templates
Sources: STDEV.S function, Microsoft Support