


Net present value tells you whether a project is worth doing once the timing of its cash flows is taken into account. This guide gives the formula, a worked example with every number shown, the right way to use Excel's NPV function, and the limits to keep in mind.
Updated November 2026
The NPV idea
Money you receive later is worth less than money in hand today, because today’s money can earn a return in the meantime. Net present value puts every cash flow on the same footing by discounting it back to today, then adding the results. If the total is above zero, the project earns more than the discount rate. If it is below zero, it earns less.
NPV = CF0 + CF1/(1+r) + CF2/(1+r)^2 + ... + CFn/(1+r)^n
Here r is the discount rate per period and CF0 is the upfront cost, entered as a negative number. Many businesses use their cost of capital as the discount rate. Others use a required return that reflects how risky the project is.
Worked example
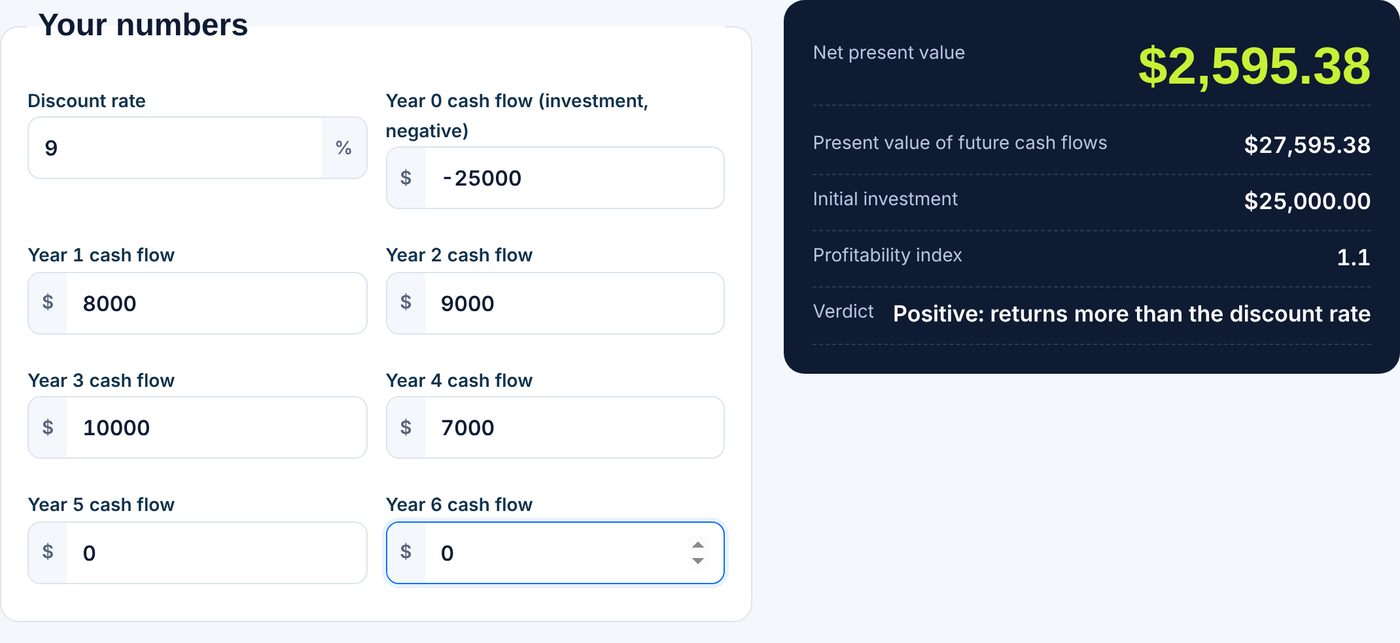
Take an illustrative equipment purchase for $25,000 that is expected to produce net cash of $8,000, $9,000, $10,000 and $7,000 over four years. Use a discount rate of 9 percent.
| Year | Cash flow | Discount factor | Present value |
|---|---|---|---|
| 0 | -$25,000.00 | 1.0000 | -$25,000.00 |
| 1 | $8,000.00 | 0.9174 | $7,339.45 |
| 2 | $9,000.00 | 0.8417 | $7,575.12 |
| 3 | $10,000.00 | 0.7722 | $7,721.83 |
| 4 | $7,000.00 | 0.7084 | $4,958.98 |
Adding the present values gives an NPV of $2,595.38. The undiscounted total is $9,000, but after discounting, the gain shrinks to $2,595, because later cash flows count for less. Because NPV is positive, the purchase clears the 9 percent hurdle. The profitability index, the present value of future cash flows divided by the investment, is 1.10. To test your own cash flows, use the NPV calculator.
Calculating NPV in Excel
Excel has an NPV function, but it has a trap. It assumes the first value in the list arrives at the end of the first period. Microsoft’s NPV function page explains that if your first cash flow occurs at the start, you must add it to the result instead of including it in the arguments. With the 9 percent rate in B1, the upfront cost in B2 and years 1 to 4 in B3:B6, the correct formula is:
=NPV(B1,B3:B6)+B2
This returns $2,595.38, the same as the table above. If you put all five values in the function, Excel would discount the upfront cost by a year and give the wrong answer. For cash flows on specific dates, use =XNPV(rate, values, dates), covered on the XNPV function page.
Choosing a discount rate
The result moves a lot with the rate. A higher rate means future cash flows are worth less, so NPV drops. Try the example at several rates:
| Discount rate | NPV |
|---|---|
| 5% | $5,179.61 |
| 9% | $2,595.38 |
| 15% | -$660.75 |
| 20% | -$2,920.52 |
The NPV is still positive at 9 percent but negative at 15 percent, so it turns negative somewhere in between. That crossover is the IRR, covered in our guide on how to calculate IRR. If a small rise in the rate wipes out the NPV, the project has little room for error.
Limits of NPV
- Estimates drive everything. NPV is only as reliable as the projected cash flows. Optimistic forecasts produce optimistic answers.
- Size is not normalized. A larger project can show a bigger NPV without being a better use of capital. Compare profitability indexes when funds are limited.
- Risk is folded into one rate. Choosing the discount rate is a judgment call.
- Timing is yearly here. Monthly or irregular cash flows need a different set-up.
The Wikipedia entry on net present value gives more background. To see how money grows at a steady rate, try the compound interest calculator, and for single-period returns use the ROI calculator. This article is general information, not financial advice.
NPV compared with payback
Payback period, the time it takes to recover the initial investment, is easy to understand but ignores the time value of money and anything that happens after payback. In the example, the cumulative cash reaches the $25,000 cost during year 3. NPV looks at the full list and discounts it, so it is the more complete test. Many analysts look at both: payback for how fast the cash returns and NPV for how much value is created. Keep a short note of the assumptions behind each cash flow so reviewers can challenge the forecast rather than the arithmetic. It also helps to show the NPV at the base rate and one rate above and below it in any report, so a reader can see how much the conclusion depends on that choice.
Frequently asked questions
What does a positive NPV mean?
The project is expected to earn more than the discount rate, so it adds value at that rate. It depends on the cash flow estimates being realistic.
Why does Excel’s NPV give the wrong answer?
Excel discounts the first value by one full period. If your first cash flow is at time zero, leave it out of the function and add it afterward.
What discount rate should I use?
Many companies use their weighted average cost of capital. For personal decisions, use the return you could earn on an alternative of similar risk.
What is the difference between NPV and PV?
Present value discounts future cash flows to today. NPV is the present value of inflows minus the upfront cost.