



When you change a price, how much will sales move? Price elasticity of demand puts a number on the answer. This guide explains the midpoint formula, works through a verified example, shows the Excel formula and explains how to read the result.
Updated November 2026
What price elasticity of demand tells you
Price elasticity of demand shows how strongly the quantity people buy responds to a change in price. If a price increase causes a big drop in sales, demand is elastic. If sales barely change, demand is inelastic. The measure helps when you decide whether to raise prices, run a promotion or forecast revenue after a change.
Price elasticity of demand = % change in quantity demanded / % change in price
Because price and quantity normally move in opposite directions, the result is usually negative. Many references report the absolute value, so a result of -1.8 may be written as 1.8.
Why the midpoint method is preferred
The simple percentage method measures each change against the starting value. That gives different answers depending on which end you treat as the start. With a price move from $8 to $10 and a quantity move from 300 to 200, the simple method gives -1.33 going up, but going back down from $10 to $8 and 200 to 300 gives -2.50. The midpoint method, also called arc elasticity, divides each change by the average of the two values, so both directions match. The economics textbook publisher OpenStax explains the midpoint method and notes this advantage.
% change in quantity = (Q2 - Q1) / ((Q1 + Q2) / 2)
% change in price = (P2 - P1) / ((P1 + P2) / 2)
Worked example
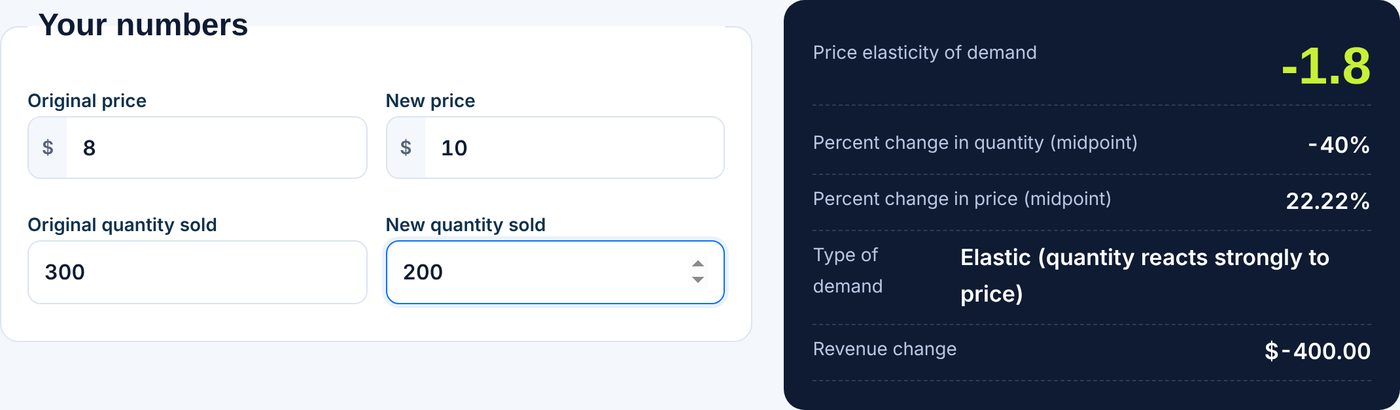
An illustrative product sells 300 units a month at $8. The price rises to $10 and sales fall to 200 units.
- Average quantity = (300 + 200) / 2 = 250. Change in quantity = -100 / 250 = -40.00%
- Average price = ($8 + $10) / 2 = $9.00. Change in price = 2 / 9.00 = 22.22%
- Elasticity = -40.00% / 22.22% = -1.80
The absolute value, 1.80, is above 1, so demand is elastic. Revenue moved from $2,400 to $2,000 a month. It fell by $400 even though the price rose. Check your own numbers with the price elasticity of demand calculator.
Reading the result
| Absolute value | Type | What it means |
|---|---|---|
| Greater than 1 | Elastic | Quantity changes by a larger percentage than price. A price rise tends to lower revenue. |
| Less than 1 | Inelastic | Quantity changes by a smaller percentage than price. A price rise tends to raise revenue. |
| Equal to 1 | Unit elastic | Quantity and price change by the same percentage. Revenue stays about the same. |
Demand is often more inelastic when a product has few substitutes, is a necessity or takes a small share of a buyer's budget. It tends to be more elastic when close alternatives exist. These are general patterns, not rules, so measure your own product.
Calculating it in Excel
With old price in B1, new price in B2, old quantity in B3 and new quantity in B4, enter:
=((B4-B3)/((B4+B3)/2))/((B2-B1)/((B2+B1)/2))
For the example, Excel returns -1.80. Wrap it in ABS() if you prefer the absolute value. The Wikipedia entry on price elasticity of demand has more on variations such as point elasticity.
Cautions
- Other things change too. Seasonality, competitor moves, ad spend and stockouts can all affect quantity, so not every change in sales is due to price.
- One price move is one data point. Test several prices if you can.
- Elasticity changes along the demand curve. The answer for a price move from $8 to $10 may not hold for $20 to $22.
- Profit is not revenue. Even where a price rise lifts revenue, check what it does to margin with the margin calculator.
For related pricing work, see our discount calculator for the effect of promotions. This guide is general information and uses example numbers only.
Getting usable data
You need two price points with the quantity sold at each, over comparable periods. If you changed a price last quarter, compare unit sales for matching weeks or months and adjust for obvious outside factors such as a holiday or a stockout. If you cannot change prices, look at historical price changes or discounts. Run a small test where you can: offer a different price to a share of customers and track the response. Keep the periods the same length and write down what else changed. A noisy estimate is still more useful than a guess, as long as you treat it with care. Remember that a measured elasticity applies to one product, one market and one period. A different customer group or a different season can behave differently, so repeat the calculation when conditions change.
Frequently asked questions
What is the midpoint formula for elasticity?
Divide the change in each variable by the average of its old and new values, then divide the quantity result by the price result.
Is price elasticity of demand always negative?
For normal goods, yes, since higher prices reduce the quantity demanded. Many sources quote the absolute value to avoid the minus sign.
What does an elasticity of 1 mean?
It is unit elastic. Quantity changes by the same percentage as price, so revenue stays roughly flat.
How can I use elasticity to set prices?
If demand is inelastic, a price increase may raise revenue. If it is elastic, a price cut may raise it. Always check the effect on profit and margin too.