


Mean, median and mode are three ways to describe the center of a set of numbers. The mean is the usual average, the median is the middle value and the mode is the value that appears most often. Each one answers a slightly different question, and choosing the wrong one can mislead you, for example when a few very large values pull the mean up. This guide shows how to calculate all three by hand, gives several worked examples with the arithmetic shown, explains when to use each, shows how outliers affect them and lists the Excel functions that do the work for you.
Updated November 2026
In this guide
- The three measures at a glance
- How to calculate the mean
- How to calculate the median
- How to calculate the mode
- Worked example: test scores
- Summary table
- How outliers change the results
- Choosing the right measure
- Mean, median and mode in Excel and Google Sheets
- Practice problems with answers
- Grouped data and frequency tables
- Common mistakes
The three measures at a glance
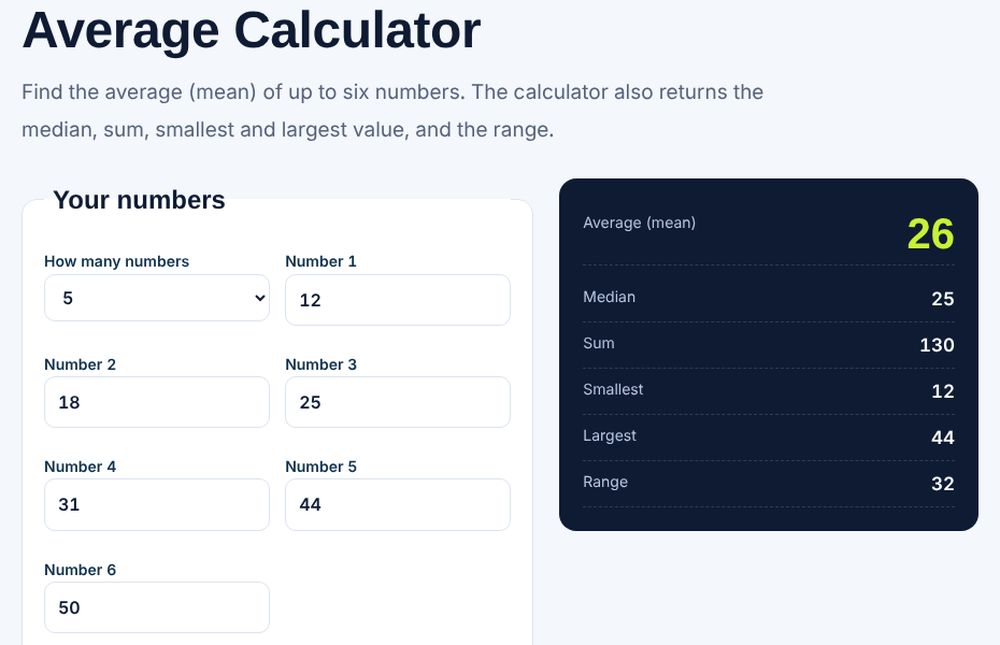
The mean adds all the values and divides by how many there are. The median is the middle value when the numbers are sorted, or the average of the two middle values when there is an even number of values. The mode is the value that occurs most often, and a set can have one mode, several modes or none. Together they tell you where the data is centered. To compute the mean quickly, use our average calculator.
How to calculate the mean
Add all the values, then divide by the count. For the data set 4, 8, 6, 5, 3, 7, 9, 5, the sum is 47 and there are 8 values, so the mean is 47 divided by 8, which is 5.875. The mean uses every value, so it reacts to every change. If one value goes up by 8, the mean goes up by 1 for this data set because 8 divided by 8 is 1. That sensitivity is useful when every value matters and a problem when there are extreme values.
How to calculate the median
Sort the numbers from smallest to largest, then pick the middle one. For the set above, the sorted values are 3, 4, 5, 5, 6, 7, 8, 9. There are 8 values, an even count, so the median is the average of the 4th and 5th values: (5 plus 6) divided by 2, which is 5.5. For an odd count, take the middle value directly. In the set 12, 15, 11, 18, 14, 16, 13, the sorted values are 11, 12, 13, 14, 15, 16, 18, and the 4th of 7 is 14, so the median is 14. A quick way to find the position is to add 1 to the count and divide by 2: for 7 values, that is position 4.
How to calculate the mode
Count how often each value appears and pick the one with the highest count. In 3, 4, 5, 5, 6, 7, 8, 9, the value 5 appears twice and all others once, so the mode is 5. If two values tie for the highest count, the data is bimodal and has two modes, such as 2, 2, 3, 4, 4, 5, where both 2 and 4 are modes. If every value appears once, as in 11, 12, 13, 14, 15, 16, 18, there is no mode. The mode is the only one of the three measures that also works for categories, such as the most common shirt size or the most popular product.
Worked example: test scores
A class has the following scores: 72, 85, 90, 85, 68, 77, 85, 92, 74. The sum is 72 plus 85 plus 90 plus 85 plus 68 plus 77 plus 85 plus 92 plus 74, which is 728. There are 9 values, so the mean is 728 divided by 9, which is 80.9. Sorted, the scores are 68, 72, 74, 77, 85, 85, 85, 90, 92. The 5th of 9 values is 85, so the median is 85. The value 85 appears three times, so the mode is also 85. The mean is a bit lower than the median because of the low scores of 68 and 72, so the median describes the typical student better here.
Summary table
The table below compares the three measures for the same set of numbers.
| Measure | How to find it | Data: 3,4,5,5,6,7,8,9 | Best used when |
|---|---|---|---|
| Mean | Sum divided by count | 5.875 | Data is symmetric with no big outliers |
| Median | Middle of sorted values | 5.5 | Data is skewed or has outliers |
| Mode | Most frequent value | 5 | Data is categories or you want the most common value |
How outliers change the results
An outlier is a value that is far from the rest. Take the data 20, 22, 23, 25, 26 and 300. The sum is 416 and there are 6 values, so the mean is 69.3, which describes none of the actual values. The median is the average of 23 and 25, which is 24, and it still represents the typical value. This is why reports on salaries and house prices often use the median: a few very high values pull the mean up. If you see a mean much higher or lower than the median, check for outliers and decide which one is right for your question.
Choosing the right measure
Use the mean for data that is roughly symmetric and when you need to use every value, such as grades or average cost. Use the median for skewed data such as incomes, home prices and waiting times. Use the mode for categories or to find the most common value, such as the most ordered size or the most frequent score. When in doubt, report both the mean and the median, and say which one you use. To see how spread out the values are around the mean, read our guide to standard deviation.
Mean, median and mode in Excel and Google Sheets
With values in A2:A10, use =AVERAGE(A2:A10) for the mean, =MEDIAN(A2:A10) for the median and =MODE.SNGL(A2:A10) for the first mode. To list all modes, use =MODE.MULT(A2:A10), which returns an array. The older MODE function still works. If a set has no mode, Excel returns #N/A. Blank cells and text are ignored by these functions, while zeros are included, so check the range. See Microsoft’s page on the AVERAGE function for details. For a weighted mean, read our guide to calculating a weighted average.
Practice problems with answers
Try these. Set A: 2, 4, 4, 6, 9. Mean 25 divided by 5 is 5, median 4, mode 4. Set B: 10, 12, 12, 15, 18, 21. Mean 88 divided by 6 is 14.67, median (12 plus 15) divided by 2 is 13.5, mode 12. Set C: 1, 1, 2, 2, 3. Mean 9 divided by 5 is 1.8, median 2, modes 1 and 2. Set D: 50, 52, 55, 500. Mean 657 divided by 4 is 164.25, median (52 plus 55) divided by 2 is 53.5, no mode. Notice how the outlier of 500 inflates the mean in set D, and which measure you would trust for the typical value.
Grouped data and frequency tables
When data comes in a frequency table, you can still find all three measures. Suppose a shop recorded the number of items per order: 1 item in 12 orders, 2 items in 20 orders, 3 items in 10 orders and 4 items in 3 orders. The total number of orders is 45. The total items are 1 times 12 plus 2 times 20 plus 3 times 10 plus 4 times 3, which is 12 plus 40 plus 30 plus 12, or 94. The mean is 94 divided by 45, which is 2.09 items per order. The mode is 2 because it has the highest frequency of 20. For the median, find the middle position, which is the 23rd value of 45. The first 12 values are 1, the next 20 values cover positions 13 to 32, so the 23rd value is 2, and the median is 2. Frequency tables like this save time on large data sets because you multiply and add instead of listing every value.
Common mistakes
The first mistake is forgetting to sort the data before finding the median. The second is mixing up the count for the median position in an even set. The third is dividing by the wrong count when finding the mean, for example dividing by 9 when there are 8 values. The fourth is saying there is no mode when the data actually has several tied values. Finally, be careful with rounding: keep extra decimals in the middle of the calculation, then round the final answer to match the precision of the data.
Frequently asked questions
What is the difference between mean and median?
The mean is the sum divided by the count. The median is the middle value of the sorted data.
Can a data set have more than one mode?
Yes. Two or more values can tie for the highest frequency.
When should I use the median instead of the mean?
Use the median when the data is skewed or has outliers, such as incomes or house prices.
What is the Excel function for mode?
Use MODE.SNGL for one mode and MODE.MULT for several.
What if there is no mode?
If every value appears once, the data has no mode.
Related guides and free tools
- Average calculator
- Standard deviation calculator
- How to calculate standard deviation
- How to calculate a weighted average
- All free calculators
- All free calculators and templates
Sources: AVERAGE function, Microsoft Support