



Inventory turnover tells you how many times a business sells through and replaces its stock in a period. A high number usually means goods move quickly; a low one can mean slow sellers, over-buying, or cash sitting on a shelf. It is one of the first figures a lender or buyer checks for a product business, and you can calculate it from numbers you already have.
Updated November 2026
The formula
Inventory turnover = Cost of goods sold / Average inventory
Average inventory = (Beginning inventory + Ending inventory) / 2
Use cost of goods sold (COGS), not sales revenue, in the numerator. Inventory is carried at cost, so dividing cost by cost keeps the comparison fair. Revenue includes your markup and would overstate turnover. If you need a refresher on getting COGS, see our guide on how to calculate cost of goods sold.
Worked example
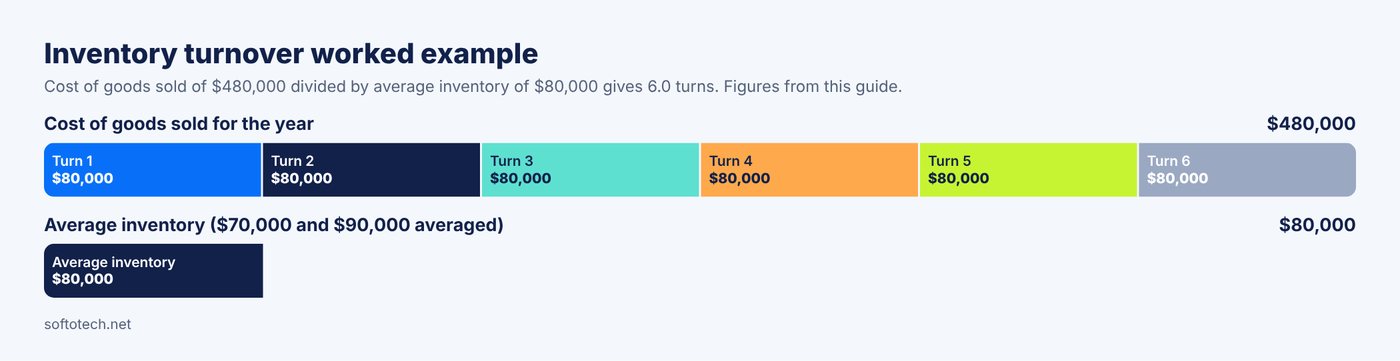
Take a small online shop with these illustrative annual figures:
| Item | Amount |
|---|---|
| Cost of goods sold for the year | $480,000 |
| Inventory on January 1 | $70,000 |
| Inventory on December 31 | $90,000 |
| Average inventory | ($70,000 + $90,000) / 2 = $80,000 |
| Inventory turnover | $480,000 / $80,000 = 6.0 times |
The shop sold through and restocked its inventory six times during the year. We recomputed this independently to confirm the figures.
Days sales of inventory (days in inventory)
Turnover is easier to feel when converted to days. Days sales of inventory (DSI) = 365 / Inventory turnover. For the example: 365 / 6.0 = 60.8 days. On average, a unit sits about 61 days between arriving and selling. You can also calculate it directly as (Average inventory / COGS) x 365, which gives the same $80,000 / $480,000 x 365 = 60.8 days.
For a quarter, use quarterly COGS and 90 days (or 91, as you prefer) and say which you used. Mixing an annual COGS figure with a quarterly day count is a common error that produces results several times too large or small.
Why the average matters
You could divide by ending inventory alone: $480,000 / $90,000 = 5.33 turns, or 68.4 days. That is lower because the shop built up stock by year end. Using the average smooths seasonal swings. If your inventory is very seasonal, a 12-month average of month-end balances is more accurate than two points. Whatever method you pick, use it every period so trends are comparable.
Excel formulas
Set up cells like this: COGS in B2, beginning inventory in B3, ending inventory in B4.
- Average inventory:
=AVERAGE(B3:B4) - Turnover:
=B2/AVERAGE(B3:B4) - Days sales of inventory:
=365/(B2/AVERAGE(B3:B4)) - Monthly average from 12 month-end balances in C2:C13:
=AVERAGE(C2:C13) - Guarding against empty inventory:
=IFERROR(B2/AVERAGE(B3:B4),0)
If you track stock on a sheet, our inventory template for Excel keeps quantities and values by item so you can pull beginning and ending balances without rebuilding them.
What counts as a good turnover?
There is no universal benchmark. A grocery seller turns stock many times a year; a furniture or jewelry seller turns it only a few times. Compare your figure with your own prior periods and with businesses selling similar goods. Rising turnover with stable margins is healthy. Rising turnover because you are running out of popular items is not, and lost sales will show up elsewhere.
Ways to improve a low turnover
- Identify the slowest 10 to 20 percent of items and discount, bundle or stop reordering them.
- Order smaller quantities more often if suppliers allow it.
- Set reorder points from actual sales rates instead of guesses.
- Check pricing: slow items sometimes simply cost too much. Our gross profit calculator shows what a price cut does to your margin before you commit.
Limits to keep in mind
Turnover depends on your inventory valuation method (FIFO, LIFO or average cost) because that changes both COGS and ending inventory. Under IRS rules, businesses that keep inventory generally have to value it at the beginning and end of each tax year to figure cost of goods sold, as IRS Publication 538 explains. This article is general education, not tax or accounting advice.
Frequently asked questions
What is the inventory turnover formula?
Inventory turnover equals cost of goods sold divided by average inventory. Average inventory is the beginning balance plus the ending balance, divided by two.
Should I use sales or COGS to calculate inventory turnover?
Use COGS. Inventory is recorded at cost, so cost of goods sold matches it. Sales include markup and would overstate how fast stock moves.
How do I convert inventory turnover to days?
Divide 365 by the turnover ratio. A turnover of 6.0 gives about 60.8 days sales of inventory.
Is a higher inventory turnover always better?
Not always. A very high figure can mean you stock too little and lose sales to stock-outs. Look at turnover together with gross margin and how often items run out.