



The current ratio is one of the first numbers a lender or owner checks on a balance sheet. It shows whether the business has enough short-term resources to cover short-term bills. This guide gives the formula, a worked example, the quick ratio and how to read both.
Updated November 2026
The current ratio formula
The current ratio checks whether a business has enough short-term resources to pay its short-term bills. It uses two numbers from the balance sheet:
Current ratio = Current assets / Current liabilities
Current assets are cash and items expected to turn into cash within a year, such as accounts receivable and inventory. Current liabilities are obligations due within a year, such as accounts payable, short-term loans, accrued expenses and the part of long-term debt due this year. A ratio above 1 means current assets are larger than current liabilities.
Worked example
An illustrative company reports these balance sheet items:
| Current assets | Amount |
|---|---|
| Cash | $40,000 |
| Accounts receivable | $70,000 |
| Inventory | $110,000 |
| Prepaid expenses | $20,000 |
| Total current assets | $240,000 |
Total current liabilities are $160,000.
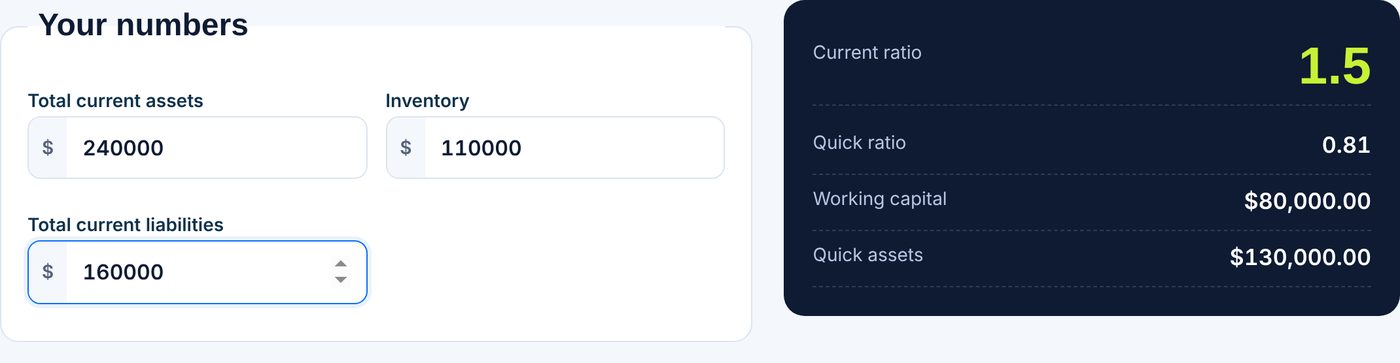
Current ratio = 240,000 / 160,000 = 1.50. That means the company has 1.50 dollars of current assets for every dollar of current liabilities. Enter your own balance sheet figures into the current ratio calculator to see the same calculation, along with the quick ratio.
The quick ratio
The current ratio treats inventory and cash alike, but inventory has to be sold first. The quick ratio, also called the acid-test ratio, is a stricter measure that leaves out inventory, and in its stricter form also prepaid expenses. A common version counts only cash and receivables:
Quick ratio = (Cash + Accounts receivable) / Current liabilities
For the example: (40,000 + 70,000) / 160,000 = 0.69. A simplified version subtracts only inventory from current assets: (240,000 – 110,000) / 160,000 = 0.81. The two versions differ because of the prepaid expenses, so say which one you used when comparing with others.
The gap between the current ratio of 1.50 and the quick ratio of 0.69 tells you something useful: much of this company's liquidity is tied up in inventory. If sales slow, it could struggle to pay bills on time even though the current ratio looks healthy. The Wikipedia article on the current ratio and its entry on the quick ratio cover the definitions further.
Calculating it in Excel
If current assets are in B1, inventory in B2 and current liabilities in B3, use =B1/B3 for the current ratio and =(B1-B2)/B3 for the simplified quick ratio. For working capital, the dollar cushion, use =B1-B3. In the example, working capital is $80,000. Round the display to two decimals with =ROUND(B1/B3,2).
How to interpret the result
- Below 1. Current liabilities exceed current assets. That is not always a crisis, for instance for businesses that collect cash before paying suppliers, but it deserves a look.
- Around 1 to 2. Often seen as comfortable, but this depends heavily on the industry.
- Very high. It might mean idle cash, excess inventory or slow collection of receivables.
There is no universal target. Compare the ratio with your own past periods and with similar businesses. A single balance sheet is a snapshot on one date, so also look at the trend and at how quickly cash comes in. Lenders often review this ratio, along with measures like the debt service coverage ratio in our guide to how to calculate DSCR for a rental property.
Ways to improve a low ratio
You can raise current assets by collecting receivables faster, selling slow inventory or holding more cash. You can lower current liabilities by negotiating longer payment terms, paying down short-term debt or refinancing it into longer-term debt. Watch for one-off fixes that change the ratio on the reporting date but not the underlying cash position. To see how profit feeds liquidity, check your gross profit. This article is general information, not financial advice.
Current ratio versus other liquidity checks
The current ratio is easy to compute, but it has blind spots. It does not show when bills are due or when customers will pay, and it counts inventory at its recorded value whether or not it will sell at that price. A business with a healthy ratio can still run short of cash if its biggest receivables are late. That is why many owners also watch a cash flow forecast, days of receivables outstanding and days of payables outstanding alongside the ratio. Together they show the pattern behind the snapshot. For a business with seasonal sales, compare the same month year over year, because the ratio can swing as inventory builds ahead of a busy season and then converts to cash.
Frequently asked questions
What is a good current ratio?
It depends on the industry and business model. Many analysts look for a ratio above 1, but compare yours with similar companies and your own trend.
What is the difference between current ratio and quick ratio?
The quick ratio excludes inventory, and sometimes prepaid expenses, because they are harder to turn into cash fast. It is a stricter test of liquidity.
Can a current ratio be too high?
Yes. It can point to unused cash, slow-moving inventory or receivables that are not being collected.
Where do I find current assets and current liabilities?
Both totals appear on the balance sheet. Many statements list them as subtotals under assets and liabilities.