



If a number grew from one value to another over several years, you often want a single yearly growth rate to describe it. That is what the compound annual growth rate, or CAGR, gives you. This guide shows the formula, a worked example with verified numbers and the Excel formulas, then explains where CAGR can mislead.
Updated November 2026
The CAGR formula
CAGR is the constant yearly growth rate that links a starting value to an ending value across a set number of years. The formula is:
CAGR = (Ending value / Beginning value)^(1 / Years) - 1
The exponent 1/Years is what undoes the compounding. If a value grew 75 percent in total over four years, you cannot just divide 75 by four, because each year grew from a bigger base than the one before. Taking the fourth root of the growth multiple finds the one rate that, applied four times in a row, lands on the same result.
Worked example
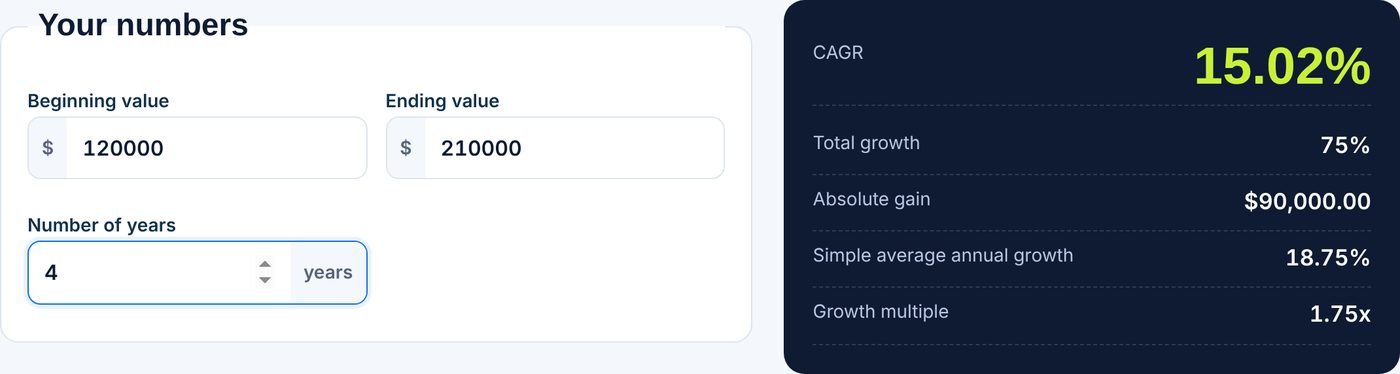
Say a small business had revenue of $120,000 in year 0 and $210,000 four years later. The numbers are an illustration, not real data.
- Growth multiple: 210,000 / 120,000 = 1.75
- Fourth root: 1.75^(1/4) = 1.1502
- Subtract 1: 15.02% CAGR
Total growth was 75 percent. The simple average, 75 divided by 4, is 18.75 percent a year, which is higher than the CAGR of 15.02 percent because it ignores compounding. Growing at exactly 15.02 percent a year gives this path:
| Year | Revenue at constant CAGR |
|---|---|
| 0 | $120,000 |
| 1 | $138,020 |
| 2 | $158,745 |
| 3 | $182,583 |
| 4 | $210,000 |
Year 4 lands on $210,000, matching the ending value. The real year-by-year numbers could have been lumpy, and CAGR does not show that. You can run your own numbers in our CAGR calculator.
Calculating CAGR in Excel
With the beginning value in B1, the ending value in B2 and the years in B3, use =(B2/B1)^(1/B3)-1. Format the cell as a percentage. Excel also has the RATE function, which solves for the periodic rate. For a CAGR use =RATE(B3,,-B1,B2). The two empty commas skip the payment argument, and the beginning value is entered as negative because RATE treats it as money paid out. Microsoft describes the arguments on its RATE function support page. Both formulas return 15.02% for the example above.
What CAGR does and does not tell you
CAGR is useful for comparing things with different time spans, such as two stocks held for different periods, or revenue against customer growth. It is a smoothed figure. A fund that rose sharply and then fell can have the same CAGR as one that climbed steadily, even though the second was far less stressful to hold.
- It only uses two points. Choosing a different start or end date can change the answer a lot.
- It ignores cash flows. If you added or withdrew money during the period, CAGR will misstate your return. An internal rate of return handles that case.
- It is backward looking. A past CAGR does not predict the next one.
- It needs positive values. A beginning or ending value of zero or below has no real result in this formula.
For more background on the concept, the Wikipedia entry on compound annual growth rate covers the definition and common uses.
Using CAGR to look forward
You can turn the formula around. If you want revenue to reach a target in a set number of years, plug the target in as the ending value to see the growth rate you would need. If you assume a growth rate, multiply the beginning value by (1 + rate) to the power of the years. Projects like this are only estimates. To see how a balance builds with regular deposits, try the compound interest calculator. To compare the gain against what you put in, the ROI calculator is a good companion. To see what compounding adds compared with a flat rate, the simple interest calculator makes a useful contrast.
Common mistakes
The most frequent error is counting the wrong number of years. If you have values for 2021 and 2025, that is four years of growth, not five, because growth happens between the two points. Another is mixing a percentage and a decimal in Excel, so check that the cell is formatted as a percent. A third is applying CAGR to a series that includes a zero or negative value, which makes the formula fail. And be careful when comparing CAGRs from different start dates: a figure that starts at a market low will look better than one that starts at a high, even for the same asset. State the dates whenever you quote a CAGR so the reader can judge for themselves.
Frequently asked questions
What is a good CAGR?
There is no universal answer. Compare the CAGR with a relevant benchmark or your own goal over the same dates. In the example above, 15.02 percent would only be good or bad relative to the industry, risk and alternatives.
Is CAGR the same as average annual growth?
No. Average annual growth adds up yearly changes and divides, which ignores compounding. The example gives 18.75 percent for the simple average and 15.02 percent for CAGR.
Can CAGR be used for periods shorter than a year?
You can enter the period as a fraction of a year, but annualizing a short period can make the result look much larger or smaller than it really is. Use caution.
Why does my CAGR not match my actual yearly returns?
CAGR is a smoothed rate between two dates. Real yearly returns vary, and the path can differ a lot even when the start and end values are the same.